
需求
40个vps节点,部署不同应用,需要监控资源的实际使用情况,方便后续的资源调整。
基本方案
- prometheus的node_exporter获取vps节点的资源使用情况(cpu、内存、网络io、磁盘io等)
- prometheus拉取exporter的数据,并存储
- grafana以prometheus作为数据源,展示监控数据
- nginx暴露grafana的服务到公网
PS:
- prometheus有多种exporter,后续如果应用的流量上来了,可以轻松地增加对应用的监控,且可以方便地增加告警;
- grafana拥有可以直接导入使用的模板,让配置更方便;
- prometheus支持service discovery,但资源有限且业务相对稳定,并不会随意变更vps节点,直接在prometheus中配置节点就好了。
服务部署环境
- 1C1G的vps一台,部署prometheus+grafana+nginx
- 操作系统为ubuntu20.04
实施
1)node_exporter
在需要监控的vps节点上安装
wget https://github.com/prometheus/node_exporter/releases/download/v1.1.2/node_exporter-1.1.2.linux-amd64.tar.gz

tar -zxvf node_exporter-1.1.2.linux-amd64.tar.gz
设置node_exporter为自启动服务
cd node_exporter-1.1.2.linux-amd64/
cp node_exporter /usr/bin
vi /etc/systemd/system/node_exporter.service
node_exporter.service内容如下,node exporter默认端口为9100,这里修改为19898:
[Unit]
Description=Node Exporter

[Service]
User=root
ExecStart=/usr/bin/node_exporter   --web.listen-address=:19898

[Install]
WantedBy=multi-user.target
systemctl start node_exporter.service
systemctl enable node_exporter.servicePS:如果使用oracle的free vps,需要通过iptable开放端口
iptables -I INPUT -p tcp --dport 19898 -j ACCEPT2)使用docker-compose安装prometheus和grafana服务
docker-compose.yml内容如下
version: '3.5'

volumes:
  prometheus-data:
  grafana-data:

services:
  prometheus:
    image: prom/prometheus
    container_name: prometheus
      #ports:
      #    - 9090:9090
    volumes:
      - prometheus-data:/prometheus
      - ./prometheus.yml:/etc/prometheus/prometheus.yml
    command:
      - '--config.file=/etc/prometheus/prometheus.yml'
      - '--web.enable-admin-api'
      - '--web.enable-lifecycle'
      - '--storage.tsdb.retention.time=200h'

    logging:
      options:
        max-size: 10m
    networks:
      - localnet

  grafana:
    image: grafana/grafana
    container_name: grafana
    networks:
      - localnet
    #ports:
    #    - 3000:3000
    volumes:
      - grafana-data:/var/lib/grafana
    logging:
      options:
        max-size: 10m

networks:
  localnet:
external: true因为nginx服务后端接入的服务不止prometheus,所以将nginx的docker服务拆到其他docker-compose文件中。网络共用localnet,这样nginx就可以通过容器名称直接访问prometheus服务。
创建本地docker网络,命令如下
docker network create localnet根据自己服务的情况,选择存储的retention配置,我这里是--storage.tsdb.retention.time=200h,还可以配置--storage.tsdb.retention.size
添加prometheus.yml
global:
    scrape_interval: 60s
    external_labels:
        monitor: 'self-hosted'

scrape_configs:
    - job_name: 'prometheus'
      static_configs:
          - targets:
                - 'localhost:9090'
            labels:
                instance: prometheus

    - job_name: 'VPS监控'
      static_configs:
          - targets:
                - '需要监控的vps的IP:19898'
            labels:
                instance: 'vps1'
          - targets:
                - '需要监控的vps的IP:19898'
            labels:
instance: 'vps2'此时docker-compose up -d 启动服务跑起来就好了。
3)配置nginx反向代理
docker-compose.yml文件如下,使用cloudflare的证书最多可以15年,letsencrypt每3个月需要更新一次。
version: "3.5"

networks:
  localnet:
    external: true

services:
  nginx:
    image: nginx:1.19.10
    environment:
      TZ: Asia/Shanghai
    restart: always
    container_name: nginx
    volumes:
      - ./data/nginx:/etc/nginx/conf.d
      - ./data/cfcert:/etc/cfcert
    ports:
      - 80:80
      - 443:443
    networks:
      - localnet
    logging:
      options:
        max-size: 10m
公网服务的反代配置-monitor.conf
server {
    listen 80;
    server_name 你的域名;

    location / {
        return 301 https://$host$request_uri;
    }
}
upstream grafana-server{
    server grafana:3000;
}
server {
    listen 443 ssl;

    server_name 你的域名;
    ssl_certificate /etc/cfcert/你的域名.pem;
    ssl_certificate_key /etc/cfcert/你的域名.key;
        #添加如下内容即可防止爬虫
        if ($http_user_agent ~* "qihoobot|Baiduspider|Googlebot|Googlebot-Mobile|Googlebot-Image|Mediapartners-Google|Adsbot-Google|Feedfetcher-Google|Yahoo! Slurp|Yahoo! Slurp China|YoudaoBot|Sosospider|Sogou spider|Sogou web spider|MSNBot|ia_archiver|Tomato Bot")
        {
        return 403;
        }
    location / {
        proxy_pass http://grafana-server;
        proxy_redirect     off;
        proxy_set_header   Host             $host;
        proxy_set_header   X-Real-IP        $remote_addr;
        proxy_set_header   X-Forwarded-For  $proxy_add_x_forwarded_for;
        proxy_set_header X-Forwarded-Proto https;
    }
}
`docker-compose up -d` 启动nginx服务,就可以通过你的域名访问grafana面板了。
4)grafana面板配置
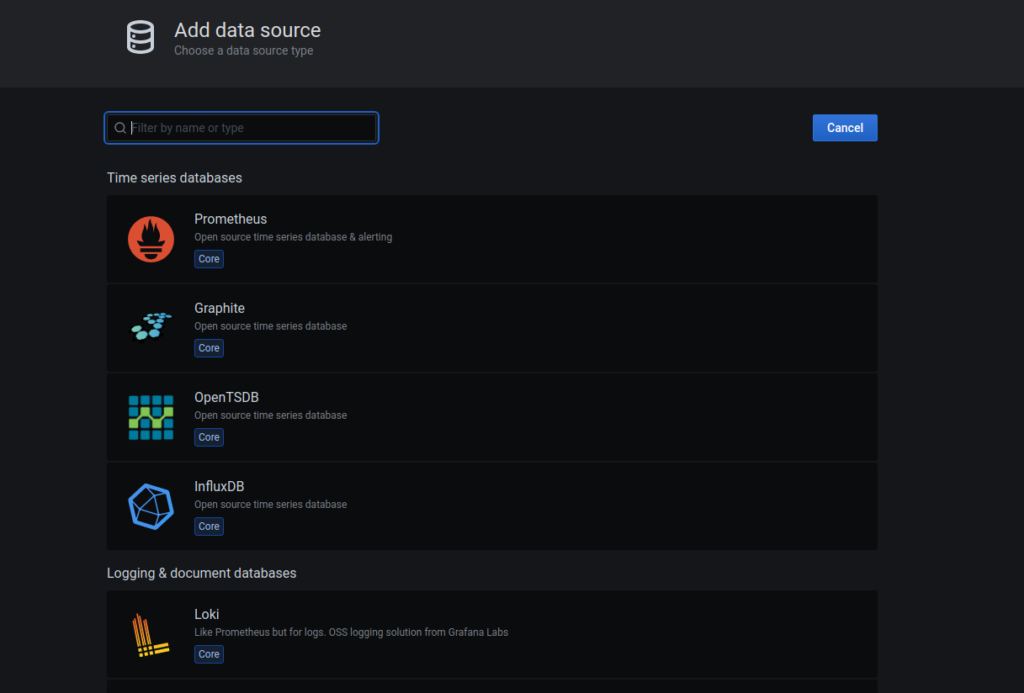
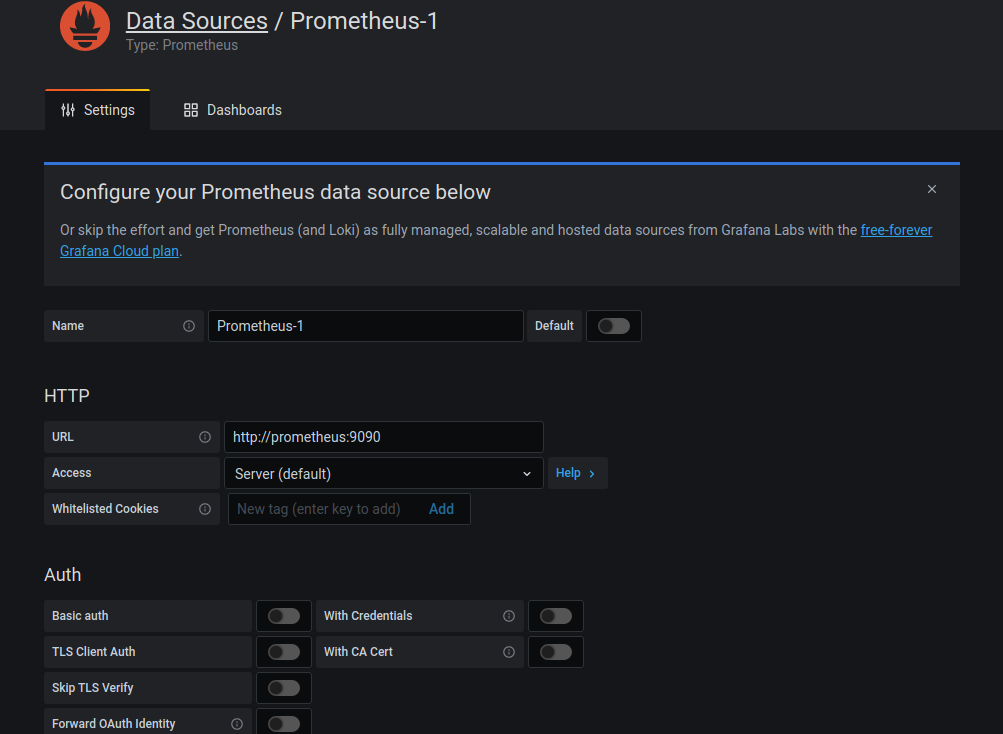
数据源直接选择prometheus即可
注意URL使用的是prometheus的容器名称
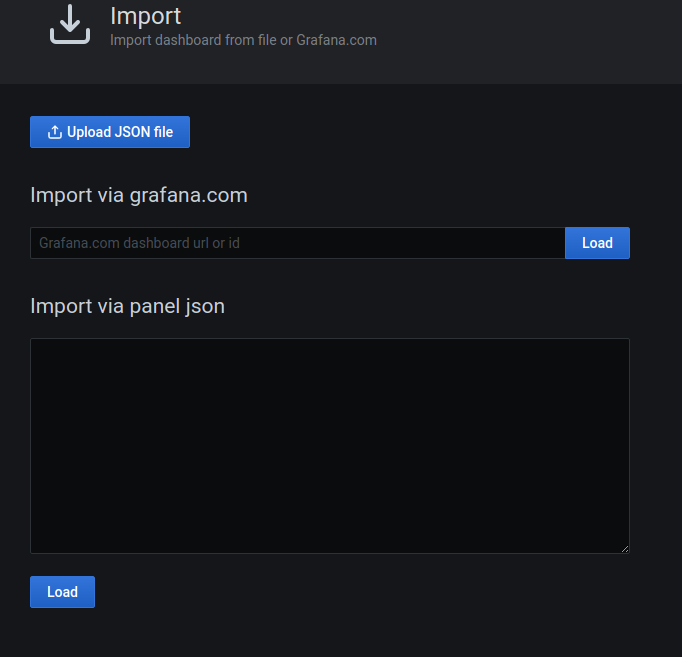
grafana官网可以找到大量的面板模板(https://grafana.com/grafana/dashboards?dataSource=prometheus),填入对应的dashboard id即可,如8919
至此配置完成。
最终面板的效果如下
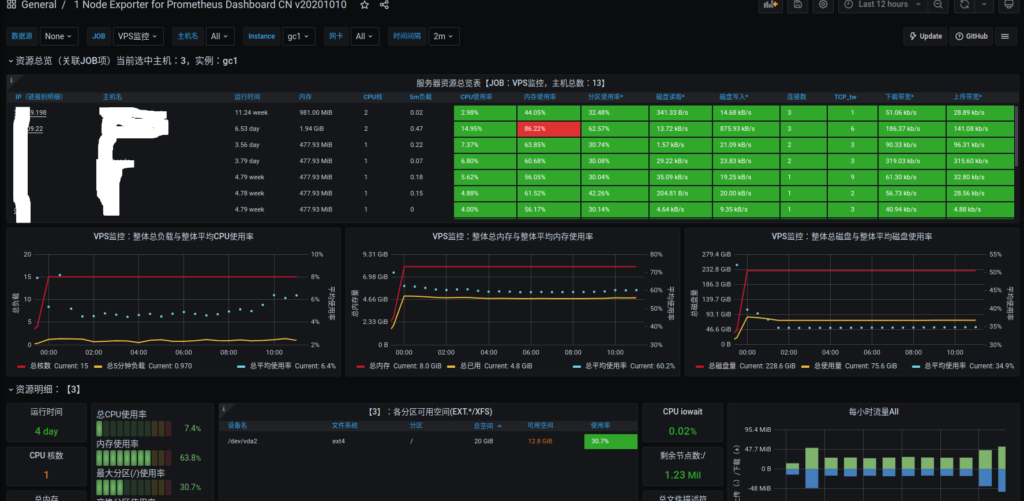
但是部署40个节点的node_exporter也是很费劲的,有空还是需要学习下ansible
Be First to Comment